Grider, Clayton
product information
description
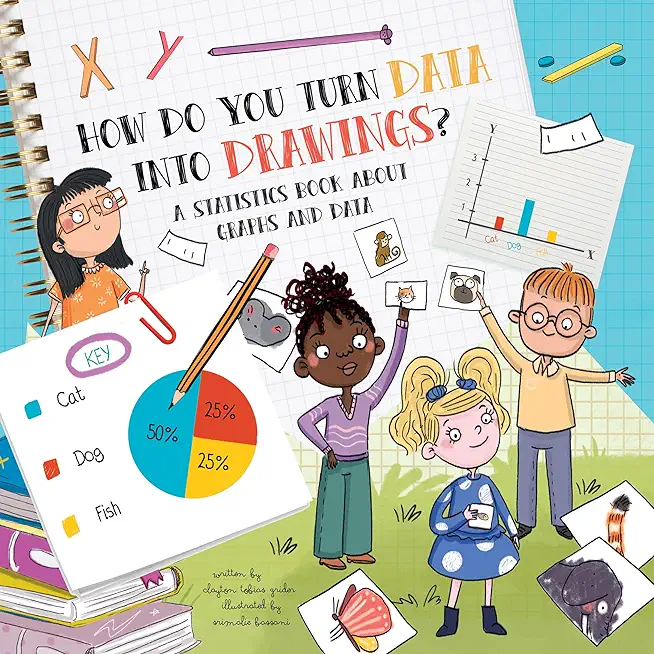
n data into graphs and charts? A basic explanation of statistics concepts including descriptive and inferential statistics, collecting and recording data, how to make various graphs, and more is explored through charts, illustrations, and informative text in this new addition to the How Do series. Includes activities in the back of the book. About the How Do series: These fully-illustrated nonfiction picture books are a great introduction to various STEM topics. Each title includes facts and figures, simple diagrams and hilarious illustrations and is written in a question-and-answer format to encourage readers to ask questions and guess the answers before exploring the science behind the correct answers.
member goods
No member items were found under this heading.
listens & views

WIR MACHEN MUSIK DEUTSCHE 1921-1944 ...
by WIR MACHEN MUSIK DEUTSCHE 1921-1944 / VARIOUS
COMPACT DISCout of stock
$15.75
Return Policy
All sales are final
Shipping
No special shipping considerations available.
Shipping fees determined at checkout.


